| Pages:
1
2 |
jdowning
Oud Junkie

Posts: 3485
Registered: 8-2-2006
Location: Ontario, Canada
Member Is Offline
Mood: No Mood
|
|
A Lo Cost, Hi Tech Aid to Tonewood Selection?
The majority of high strength softwood tree stands (such as Sitka and Englemann Spruce) in North America and Canada are sold to the big lumber
companies - destined for structural timbers where a high strength to weight ratio is a critical requirement. Wood is a highly variable material so the
process from the forest to sawmill to market is a 'value added' procedure of careful selection and grading to separate the highest value material from
the lowest grades. Grading is undertaken by experienced operators based upon the appearance of the timbers.
The general physical properties of each wood species is determined by both destructive and non destructive methods. A well established non destructive
method is to measure the speed of sound through a log or piece of lumber as this provides a measure of the elasticity or stiffness of the wood
(Modulus of Elasticity) as well as a measure of the all important stiffness to weight ratio.
The selection of 'tonewood' for instrument sound boards is much the same (based upon similar criteria as structural timbers) but on a much smaller
scale. Some tonewood suppliers also claim to use acoustic testing as part of the selection process.
To measure the speed of sound in a log or a piece of timber, a standard procedure is to send a sonic pulse through the wood at one end and measure the
time that it takes for the pulse to be detected by a sensor at the other end. The speed of the sound wave is then the distance between the pulse
transmitter and receiving sensor divided by the elapsed time recorded. As the speed of sound in wood is pretty fast (up to 6000 metres/second or so)
the measurement of elapsed time requires some sophisticated (and expensive!) electronic hardware. Or does it?
An alternative approach employed by the industry is to simply hit the end of a log with a hammer and measure the time it takes for the sound pulse to
be reflected back (the echo) from the other end of the log (the distance, in this case being 2X the length of the log). This again requires some
expensive electronic hardware. Or does it?
Not having any commercial electronic 'gizmos' costing thousands of dollars - but with a supply of freshly felled Eastern White Pine logs - I thought
that it would be interesting to see what could be achieved using just a Personal Computer (of modest power, 2006 vintage), a small hammer and a
portable digital recorder using the free open source audio editing software 'Audacity' to analyse the audio files.
More to follow.
|
|
|
Aymara
Oud Junkie
Posts: 1162
Registered: 10-14-2009
Location: Germany / Ruhr Region
Member Is Offline
Mood: No Mood
|
|
Hi J!
Interesting ... I'm curious for more.
Greetings from Germany
Chris
|
|
|
jdowning
Oud Junkie
Posts: 3485
Registered: 8-2-2006
Location: Ontario, Canada
Member Is Offline
Mood: No Mood
|
|
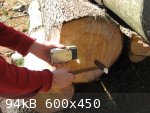
My property is old farmland planted about 25 years ago to white pine and spruce as a government re-forestation project. At the end of last year it was
necessary to cut down some of the pine to provide clear, safe access for electrical power lines entering the property. The logs - up to nearly 0.4 m
in diameter - will later be cut into planks and baulks, using a portable chain saw mill, for use in maintaining and repair of buildings on the
property. Although the wood is of no use for instrument work, the logs provide a practical test bed for the start of this investigation.
The selected log measures 3.35m in length, 0.37m diameter at the butt end and 0.32m diameter at the other end. The log is 'green' - i.e. still fully
saturated with moisture.
My sophisticated portable tools for this trial are a small hammer and a digital recorder. I happen to have a Zoom H2 recorder - which is pretty
sensitive and capable of high quality recording - but other less expensive voice recorders with USB computer connectivity - like the Sony ICD-PX 312 -
would probably do just as well.
The test was carried out in six segments. The log was struck repeatedly at one end with the hammer and the longitudinal audio response recorded with
the recorder held close to the other end of the log. The test was repeated in reverse - striking the small diameter end and with the recorder held
close to the other end.
This was a bit inconvenient as it requires two persons one doing the hammering at one end and the other holding the recorder. To avoid this
inconvenience, each end of the log was struck with the hammer while recording the reflected sound pulse at the same end - a one person operation.
Finally the audio response across the grain was recorded at both ends of the log by striking one side with the hammer and holding the recorder
diametrically opposite.
Next to analyse and review the results.


|
|
|
Aymara
Oud Junkie
Posts: 1162
Registered: 10-14-2009
Location: Germany / Ruhr Region
Member Is Offline
Mood: No Mood
|
|
Hi again,
shouldn't both recordings be done with the PC simultaniously to be able to analyse the time difference between hammer stroke and it's "echo" at the
other end? I bet this time difference will be measured in milliseconds?
Greetings from Germany
Chris
|
|
|
jdowning
Oud Junkie
Posts: 3485
Registered: 8-2-2006
Location: Ontario, Canada
Member Is Offline
Mood: No Mood
|
|
All that we have at this point is a recording of the pressure pulse and other noise generated by the hammer striking one end of the log.
The pulse - a compression wave (sound wave) travelling parallel to the longitudinal grain of the log - when it hits the other end of the log is
reflected back to the other end where the process is repeated, the pulse going backwards and forwards through the log until its strength (or
Amplitude) is rapidly diminished to zero (in less than a tenth of a second) due to the internal damping of the 'green', moisture laden wood.
The recorder placed against one end of the log picks up an impulse every time the pressure wave hits that end of the log after travelling a distance
for each cycle of twice the length (2xL) of the log. The number of times this impulse occurs each second is the frequency of the sound wave measured
in cycles per second (or Hertz). So if the frequency can be measured the speed of sound in the log - parallel to the grain - is equal to the frequency
f multiplied by 2xL.
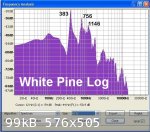
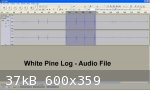
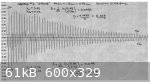
This is where the Audacity software comes in (latest version 2.0 is now available). Audacity has a nice 'Analysis' facility that can perform a
spectrum analysis of the audio files loaded from the digital recorder. The attached image is one of the audio files of the reflected hammer blows (six
strikes in this case) - a section of four of the strikes has been highlighted for analysis. The software then performs mathematical magic (Fast
Fourier Transform) resulting in a graphical plot of the range of frequencies in the sample against their amplitude.
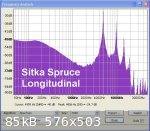
The attached image shows the frequency spectrum for the pine log where it can be seen that the predominant or fundamental frequency is 383 Hz. There
is lots of other stuff going on represented by frequencies of lesser amplitude - the two next significant being frequency peaks at twice and three
times the fundamental. (note that there are two parallel audio tracks - the recording being in stereo)
The length of the log is 3.35 metres so twice the length multiplied by the fundamental frequency gives a longitudinal speed of sound of 2566
metres/second. This is an order of magnitude close to that measured by forestry researchers who have studied property variability in stands of pine
trees.
In measuring the velocity it made no significant difference at which end of the log the recorder was placed - four sample readings agreeing within
0.3%.
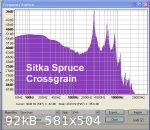
The speed of sound across the grain is less than the longitudinal value. This was measured at each end across the log diameter with the digital
recorder. The resulting velocity was found to be about 500 metres/second or a fifth of the longitudinal velocity. Again this value correlates with
that measured by the forestry research laboratories falling within the range of about 20% to 30% of the longitudinal value.
The speed of sound in timbers that have been dried to a moisture content of 12% or less can be expected to be about double these measured values -
high moisture content and high temperatures having an adverse effect on the speed of sound.
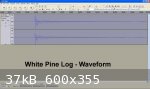
The final image shows the waveform of each sound pulse as it diminishes in amplitude over time to zero (in about 0.07seconds in this case).
The purpose of this trial is only to demonstrate the feasibility of the method applied on a large forestry scale.
Next to move on to scaled down tests on small dry wood samples to see if this might result in data of value to the luthier in assessing the goodness
or otherwise of sound board materials - a simple procedure first proposed about two years ago for selection of violin top billets by luthier Don Noon
on the Maestronet Forum.
|
|
|
jdowning
Oud Junkie
Posts: 3485
Registered: 8-2-2006
Location: Ontario, Canada
Member Is Offline
Mood: No Mood
|
|
As the speed of sound is determined indirectly using a mathematical algorithm and not by timing the sound wave in the material it is now of interest
to try to 'benchmark' the method to establish accuracy.
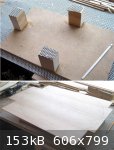
Wood is a variable, non-uniform material so 'calibration' testing was undertaken using mild steel bars of known specification (ASTM- A36). The test
rig is very basic the test bar being supported on rubber pads with the recorder at one end - the other end being struck with a very light hammer. The
hammer is simply a small brass rivet mounted on a Popsicle stick that in use is 'flicked' against the end of the bar to produce a focused 'ping'
signal of low amplitude.
The Zoom H2 recorder was used for convenience but a microphone connected to a computer could also be used to record the audio signal.
Four steel bars were tested of cross section 25x25 mm,
30x13 mm, 50x20 mm and 50x6.5 mm - to determine what effect - if any - the cross section geometry might have on the results. The bars ranged in
length from 300 to 480 mm.
Using 'Audacity' spectrum analysis the speed of sound measured longitudinally in the bars ranged from 5144 m/s to 5170 m/s the average value being
5160 metres/second.
The Modulus of Elasticity is equal to the (velocity of sound)² multiplied by material density.
Density was determined by measuring and weighing the bars. The calculated volume divided by the weight gives density which averaged 7780 kilograms/
metre³.
The Modulus of Elasticity, E is therefore (5160)²X 7780 or 207 GigaPascals.
Published results (Kaye and Laby) for the speed of sound in mild steel range between 4700 m/s and 5200 m/s with the Modulus of Elasticity as 200 GPa
and Density 7860 kg/m³. So steel is not quite as uniform as might be expected nevertheless the reasonable correlation with the test results is
encouraging.
A further comparison with test results obtained by researcher J.E. McLennan using a Lucchi Meter measuring the speed of sound in mild steel provides
an even closer correlation with Density of 7860 kg/m³, speed of sound 5137 m/s and E equal to 207 GPa. The speed of sound measurements agree to
between 0.14 and 0.64%.
The published results of the Lucchi meter testing can be found here for free access:
http://www.phys.unsw.edu.au/music/publications/mclennan/lucchi.pdf
The geometry of the bar sections had some influence on the results (as likely does the minimum length - yet to be determined).
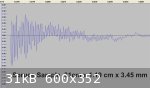
The attached image of the 25x25 mm section bar spectrum graph shows the distinct fundamental frequency of 5704 Hertz followed by the successive peaks
of lower amplitude very close to 2X, 3X and 4X the fundamental frequency.
For comparison is the attached spectrum for the flat bar of cross section geometry 50 mm wide by 6.5 mm thick. It is evident that the results are much
'noisier' with a less distinct amplitude difference between the fundamental at 5385 Hz and the next peak. This may present problems when it comes to
attempting to analyse thin wide wood samples like an oud or lute sound board - but we will see.
So far so good. Next to test some sound board material of various lengths and cross section geometry.
Edited 18 May - cross section dimensions of steel bars corrected to consistent mm.

|
|
|
jdowning
Oud Junkie
Posts: 3485
Registered: 8-2-2006
Location: Ontario, Canada
Member Is Offline
Mood: No Mood
|
|
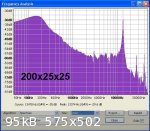
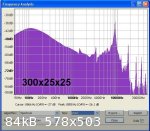
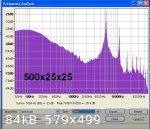
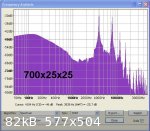
The next trial is to determine the smallest sample of wood that can give reliable results using this method and basic test rig.
Two rods 700 mm in length and 25x25 mm and 11x11 mm square cross section were prepared from a piece of Spruce (or Pine?) found among a pile of wood
pieces left over from other (non instrument making) projects - chosen because of the fine straight grain.
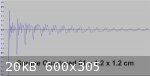
Both pieces were acoustic tested at maximum length and then shortened to provide test lengths of 600 mm, 500 mm, 400 mm, 300 mm, 200 mm and 100 mm.
The cross section size and length made no significant difference to the speed of sound measurements for rod lengths of 300 mm and longer - the
calculated speed of sound measurements all being within 0.6% of each other with the average speed being 5358 metre/second.
For the shortest length of 100 mm the resonant peaks were not well defined giving a speed of sound of less than 1000 m/s which is clearly not
correct.
The attached spectrum analysis plots show improving resonance peak definition as the rod length is increased. From this trial it is concluded that for
best results the minimum specimen length for square section rods of 25 mm or less should be 300 mm or greater.
The density of the wood sample was calculated from its measurement and weight as 394 kg/m³
From the above the longitudinal (Dynamic) Modulus of Elasticity was determined from E = 5358 x 5358 x 394 equal to 11.3 GPa.
Both the Elastic Modulus and Density are in agreement with the range of published values for Spruce.
The longitudinal Acoustic Constant, A = Speed of Sound divided by Density. For this wood sample A= 5358/394 = 13.6.
For Spruce 'tonewoods' it is said that the value of A can range between 12 and 17 - so this is a method that might be used to select the most suitable
tonewoods from a batch of pieces (or even from a scrap pile!). At least it might be used as an aid in brace wood selection from small section
billets.
|
|
|
jdowning
Oud Junkie
Posts: 3485
Registered: 8-2-2006
Location: Ontario, Canada
Member Is Offline
Mood: No Mood
|
|
Next to test the difference between the speed of sound longitudinal (parallel to) the grain and across the grain for Sitka Spruce.
This material was purchased from an aircraft manufacturer as sawn timbers - measuring 15 cm by 20 cm in section - for use as sound board material. The
selection of wood for aircraft frames and musical instrument soundboards is much the same - high stiffness to weight ratio, minimal grain run out etc.
The timbers that I purchased had grain running pretty much perfectly on the quarter although grain width was more than I would have preferred.
The samples for audio testing came from the same piece of wood. The longitudinal grain sample measured 61.4 x 4.25 x 2.81 cm. The cross grain samples
- perfectly quartered - measured 30 cm x 1.25 x 1.25 cm and were made up of two and three pieces respectively glued together with hot hide glue.
Measuring and weighing the test pieces gave an average value for density of 452 kg/m³.
The speed of sound derived from the spectrum analysis measured 5911 m/s longitudinally and averaged 1729 m/s across the grain (radial axis) so the
cross grain speed is 29% of the longitudinal speed of sound. This correlates with published values in the range of about 20% to 30%. From these
figures Modulus of Elasticity longitudinally is 15.8 GPa and the acoustic constant is 13.1.
The Modulus of Elasticity is higher than published values for Sitka Spruce suggesting that the speed of sound is a bit higher than it should be.
Apparently the speed of sound derived from acoustic measurements is always somewhat higher than values determined statically (beam deflection).
A correction to speed of sound was therefore made by reference to the frequency peaks 2X, 3X and 4X greater than the fundamental and adjusting the
fundamental frequency to an average value.
The adjusted speed of sound longitudinally is 5624 m/s giving a calculated value of E = 14.3 GPa and acoustic constant of 12.4.
The adjusted value for E is higher than the published value of 11 GPa from static bending tests (for a lower density of 400 kg/m³). However, note
that values obtained by other researhers using a Lucchi meter (see the article previously posted) for a spruce sample of 467 kg/m³ density gave E as
14.5 GPa compared to a static bending value of 10 GPa. In general higher density wood has a higher stiffness. Wood is a highly variable material!
Nevertheless, the usefulness of this method of testing is comparative rather than for strict determination of absolute values and so should be a
simple and fast method for selecting the best (acoustically) material for instrument applications from mixed a pile of potential 'tonewood'.
|
|
|
jdowning
Oud Junkie
Posts: 3485
Registered: 8-2-2006
Location: Ontario, Canada
Member Is Offline
Mood: No Mood
|
|
The best sound board materials are said to have high stiffness values both along and across the grain consistent with light weight (although some
guitar makers apparently prefer a lower cross grain stiffness i.e. measured across the width of the sound board).
As we have seen the speed of sound measured along and across grain can provide a measure of stiffness (Modulus of Elasticity = speed of sound squared
X density). Typically cross grain stiffness is about 20% to 30% of longitudinal stiffness.
Others have found that the wood grain angle both longitudinally (run out) and cross grain can dramatically affect speed of sound and hence stiffness
particularly in cross grain that is not perfectly cut on the quarter i.e. with the grain direction in the sound board section running perfectly at
90° to the surface of the sound board. Even the slightest deviation from 90° is said to be significant but there does not appear to be any available
supporting data.
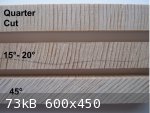
To gain some appreciation of the effect of cross grain angle on speed of sound, three samples of Sitka Spruce are currently being prepared - cut from
the same block of wood - one with grain angle perfectly 'on the quarter' and the others at about 45° and about 15° from vertical. Quartered grain
angle can vary between perfectly vertical to 45° from vertical - according to wood industry standards.
The test samples are to be assembled each from three pieces glued together with hot hide glue - so will replicate the section of a multiple piece
sound board.
The results of acoustic testing of the samples will next be reported for comparison.
|
|
|
jdowning
Oud Junkie
Posts: 3485
Registered: 8-2-2006
Location: Ontario, Canada
Member Is Offline
Mood: No Mood
|
|
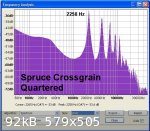
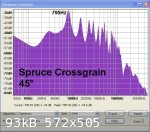
To test the effect of cross grain slope on stiffness, three test rods were prepared from slices cut from a block of Sitka Spruce. The rods measure 12
mm X 12 mm in section and
39 cm long. Grain slope from the vertical is 0° (quartered) - sample A, 15-20° - sample B and 45° - sample C.
Each rod was acoustically tested and analysed with Audacity to determine speed of sound across the grain in each case.
The corrected speed of sound in each case was A - 1785 m/s,
B - 953 m/s and C - 591 m/s and the measured density of the Spruce was 424 kg/3m³.
From this data the calculated relative Dynamic Modulus of Elasticity was A - 1.35 GPa, B - 0.39 GPa and C - 0.15 GPa.
So for a grain slope of 15-20° from a perfect quarter, stiffness is reduced to 28% and to 11% for a 45° grain slope.
Although only three datum points are available from this test it can be seen that even with a grain angle of only two degrees from vertical, cross
grain stiffness might be reduced to somewhere between 78 and 89% - all quite significant.
Presumably a comparable loss of stiffness would also be found for longitudinal grain 'run out'.
Therefore, if maximum cross grain stiffness of a sound board is an objective, the wood must be cut with the grain perfectly on the quarter - i.e.
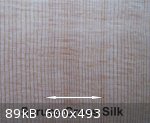
perpendicular to the sound board surface. This can be judged visually not only by examining the end grain of a sound board but by the presence of
'cross silk' - medullary rays that run across the longitudinal wood grain that are said to provide stiffness.
|
|
|
jdowning
Oud Junkie
Posts: 3485
Registered: 8-2-2006
Location: Ontario, Canada
Member Is Offline
Mood: No Mood
|
|
At this point acoustic testing has been undertaken on straight grained spruce samples with no grain 'run out' to determine the speed of sound
longitudinally (parallel to the grain) and across the grain from which the relative stiffness in each direction has been determined.
The results demonstrate that the maximum stiffness across the grain occurs when wood is cut perfectly on the quarter and is only about 20% to 30%
maximum of the stiffness longitudinally. This agrees with data from other sources. The significant difference in stiffness is easily felt by simply
bending a sound board blank along its length and across its width.
Furthermore it has been demonstrated by these tests that the grain angle in a quarter sawn board critically determines cross grain stiffness from a
maximum value when perfectly quartered (vertical grain) to only about 11% of maximum if grain angle deviates at about 45° from vertical.
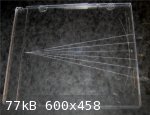
The attached sketch may help to clarify the position and minimise confusion. Here sound board blank A is cut perfectly on the quarter whereas sound
board blank B has a cross grain angle of 45° from vertical. Both samples are straight grained (longitudinally) with no grain 'run out' evident when
viewed from the side of the sound board.
This should not be confused with horizontal (flat) or vertical grain found in braces. The longitudinal stiffness of a brace is independant of grain
orientation in cross section - it can be vertical, horizontal, 45° or anywhere in between. This has been confirmed in static bending tests by luthier
Christopher Martin and by dynamic acoustic testing by Faruk Türünz (see the topic "Grain Direction in Braces" on this forum).
This assumes that a brace is perfectly straight grained longitudinally. However as we have seen grain angle can dramatically affect stiffness in sound
board across the grain so it seems likely that longitudinal grain 'run out' will also result in reduced stiffness in a brace (as well as a sound
board).
The attached sketch should help to clarify matters.
Next to test the effect of longitudinal grain run out on stiffness.


|
|
|
jdowning
Oud Junkie
Posts: 3485
Registered: 8-2-2006
Location: Ontario, Canada
Member Is Offline
Mood: No Mood
|
|
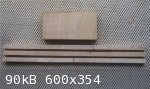
To acoustically test the effect of grain run out parallel to the grain longitudinally (as might be found either on brace or sound board material) a
block of Sitka Spruce was cut on the quarter. In this slice of wood, one half had straight grain with no run out whereas the other half had grain run
out of between 9° to 12°.
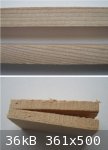
Two test pieces measuring 12 mm square X 32 cm in length were prepared from the slice - one containing the grain run out the other with straight grain
and no run out. The straight grain sample was tested for run out by splitting a small block cut from the slice. The attached image shows the two test
pieces together with the split sample which shows no evidence of run out.
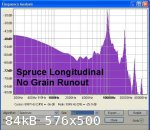
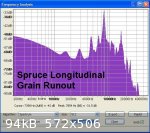
Acoustic testing of the test pieces and analysis with Audacity provided a spectrum analysis in each case with a clear fundamental (and 2X secondary)
frequency peak.
From this the speed of sound longitudinally was calculated (twice the length multiplied by the fundamental frequency) to give a corrected result of
5785 m/s for the sample with no run out and 4811 m/s corrected for the sample containing run out.
The density of each sample was calculated from linear measurement and weight and was found to be 403 kg/m³ for the former sample and 493 kg/m³ for
the sample with run out. This significant difference in density of the two sample cut from the same strip of wood is a good example of the variable
properties of wood even from the same tree.
Knowing the density of the wood the Dynamic Modulus of Elasticity was calculated from the relationship DMOE = (velocity of sound)² X density giving a
value of 13.5 GPa for the sample with no run out and 9.8 GPa for the sample containing run out. So it can be seen that the sample containing run out
is less stiff than the straight grained sample - i.e. only 84% of the stiffness of the latter. So although the effect of grain run out longitudinally
is not as much proportionally as that found in the cross grained samples previously tested it is nevertheless significant.
The effect on acoustic performance of the wood can be judged from the Acoustic Constant (otherwise known as the sound radiation coefficient R) = speed
of sound divided by the density. Sound board 'tonewoods' have a value of between 12 and (rarely) 17.
So the straight grained sample with its lower density and higher speed of sound has an R value of 14.4 which is very good. On the other hand the
sample with grain run out with its slower speed of sound and higher density has an R value of only 9.8 so should be avoided for optimum 'tonewood'
applications.
Edit - note for clarification.
In the tests for speed of sound measured longitudinally (parallel to the grain direction) the term 'grain run out' (caused by spiral growth in a tree)
has here been incorrectly applied to grain that is not perfectly straight as seen from the tangential to growth ring direction (i.e. as viewed
perpendicular to the surface of a quarter sawn sound board). A better description would probably be 'grain deviation from straight'.
The test samples were later split perpendicular to the direction of the growth rings and shown to be free of 'run out' due to spiral growth. So the
results here apply only to 'grain deviation from straight'. If there had been grain 'run out' then - according to other researchers in this field -
this would also result in a significant reduction in speed measured longitudinally.
The primary axes of wood are Longitudinal (parallel to the grain) - Radial (across the growth rings - or cross grain) and Tangential (at a tangent to
the growth rings). The tangential axis is across the thickness (or rather thinness!) of a sound board so is not under consideration here.
|
|
|
Greg
|
Thread Pruned
4-18-2012 at 05:16 AM |
jdowning
Oud Junkie
Posts: 3485
Registered: 8-2-2006
Location: Ontario, Canada
Member Is Offline
Mood: No Mood
|
|
Note that the previous 'thread pruned' note by Greg refers to a superfluous link to the 'Spruce Crossgrain 45°' spectrum image previously posted as
problems had been encountered in trying to upload this image as a thumbnail. The problem was traced to the file title that contained the invalid
degree (as in 45°) symbol. Once the offending ° character was removed from the title, the file uploaded successfully.
Microsoft Windows usually gives a warning message if symbols reserved for the function of the operating system are included in a file title but not in
this case. It so happens that where the Ctrl key of a keyboard is employed to access special symbols - such as the degree character - then Windows
does not allow that either. So we live and learn!
|
|
|
jdowning
Oud Junkie
Posts: 3485
Registered: 8-2-2006
Location: Ontario, Canada
Member Is Offline
Mood: No Mood
|
|
In order to determine the minimum dimensions of the test pieces that will give consistent results for speed of sound using this method the
longitudinal grain test samples measuring 31 cm long with cross section about 12 mm X 12 mm were further reduced in section to 12 mm X 4.5 mm and 12
mm X 3.4 mm and retested for comparison.
From the Audacity spectrum analysis, the calculated values of speed of sound were all between 1% and 2% of the values derived from the original
samples.
Previous tests have indicated that the minimum length of a test piece should not be less than 25 to 30 cm for consistent results- below this length
the measured speed of sound value drops dramatically.
Using this method the cross section dimensions should not affect the speed of sound values. So far this seems to be true if the test samples are rods
- i.e. relatively long compared to the cross section dimensions or of high 'aspect ratio' (Length/Width or Length/ Thickness).
This means that it should be possible to reliably acoustically test for sound board 'goodness' (R value) using small test strips (about 10 mm wide)
cut longitudinally from typical sawn sound board blanks that are usually available at around 3 mm in thickness. The same may apply to test strips cut
across the width of a sound board blank although this has yet to be confirmed by testing (to be reported later).
Some luthiers have proposed that the longitudinal grain Sound Radiation Coefficient should be modified to incorporate both longitudinal and cross
grain (radial) speed of sound values. Charles Woods of the Southern California Association of Violin Makers has proposed that the 'goodness' factor
based upon speed of sound should be determined by taking the square root of the product by multiplying the speed of sound longitudinal and radial,
divided by the density. A value of 6 or more on this basis is said to represent a very good sound board wood.
http://www.scavm.com/Woods.htm
Although the previously reported tests to determine speed of sound values along longitudinal and radial axes exclude samples with grain 'run out' (due
to tree spiral growth), this research paper by Martin Schleske 'Speed of Sound and Damping of Spruce in relation to the Direction of Grains and Rays'
investigates both speed of sound values for deviations from axial direction (equivalent to 'run out') as well as radial cross grain. The cross grain
values agree pretty well with the test results previously reported in this thread. See Google
CAS_speed_of_sound.pdf
The author also reports calculated values of internal damping - another important factor in sound board wood evaluation. This will also be considered
at a later date to see if the Audacity software can give some comparative calculated values of internal damping for the samples under test.
|
|
|
jdowning
Oud Junkie
Posts: 3485
Registered: 8-2-2006
Location: Ontario, Canada
Member Is Offline
Mood: No Mood
|
|
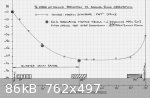
As a check to verify accuracy of the simple resonance method subject of this thread, the three values of speed of sound obtained from the cross grain
tests have been superimposed upon values for spruce derived from data published by Martin Schleske (see CAS_speed_of_sound.pdf - Google documents).
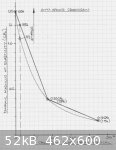
The attached image is a curve of % reduction in speed of sound versus cross grain angle derived from the Martin Schleske data (data obtained using
sophisticated test apparatus). The comparable resonance method test results show a close agreement - which is encouraging.
These results confirm that for quarter sawn sound board material, wood cut perfectly on the quarter (end grain vertical, 0°) is significantly stiffer
than wood with end grain angle
at 45° (DMOE = (SOS)² x Density).
The highest grades of commercially available sound board woods (for ouds, lutes, guitars etc) are selected - among other visually assessed attributes
- with perfectly quartered end grain to ensure maximum cross grain stiffness (consistent with 'light weight').
It can be seen that even with a slight deviation of annual ring orientation from vertical of 5% there is an SOS reduction of about 10% increasing to
about 65% reduction for a grain angle of 45%.
|
|
|
jdowning
Oud Junkie
Posts: 3485
Registered: 8-2-2006
Location: Ontario, Canada
Member Is Offline
Mood: No Mood
|
|
So far the investigation of this simplified acoustic resonance method to determine the speed of sound and hence stiffness and the R value as a measure
of sound board acoustic 'goodness' has used spruce samples that are rods much longer in length than width. The results so far are encouraging and the
method may be a reliable way to check sound board material from which relatively small samples have been prepared. The question now is can this method
be used to acoustically test sound board blanks i.e. thin plates of wood. I have three multiple piece sound board blanks of Sitka spruce in stock from
another project so will use these as test samples.
A good review of the basic science of the acoustic resonance method can be found in Chapter 2 'Introduction on Acoustics' - part of the thesis
'Acoustic Studies on Wood' by Helge Hansen, University of Canterbury, New Zealand, 2006 (freely available on Google documents). Hansen explains that
the Dynamic MOE = (Speed of Sound)² x Density is only applicable for elastic materials shaped as long slender rods (which approximates to a one
dimensional, uniaxial case).
What is happening in the acoustic resonance situation is that the sound wave - bouncing back and forth between the ends of a wood sample (long thin
rod) create standing waves (regions of maximum/minimum pressure and displacement) due to constructive/destructive interference between the incoming
and reflected sound waves. The sample once set in vibration (by hitting one end with a hammer) produces harmonics - the first being the fundamental,
the second harmonic having a frequency of vibration twice that of the fundamental, the third harmonic three times the frequency of the fundamental and
so on.
The wavelength of the first harmonic is 2X the length of the sample, that of the second harmonic is equal to the length of the sample, that of the
third harmonic 2/3 the length of the sample and that of the fourth harmonic half the length of the sample. So the speed of sound calculated from the
first harmonic frequency is f1 x 2L, for the second f2 x L, for the third f3 x 2L/3, for the fourth f3 x L/2 and so on.
For wood in the form of a thin flat plate (like a sound board blank), when struck with a hammer at one side, the compression sound wave is not
concentrated in a uniaxial direction but spreads radially and - reflected from the exterior surfaces of the blank - form a spectrum of interference
waves that may not conform to the ideal uniaxial case.
More to follow
|
|
|
jdowning
Oud Junkie
Posts: 3485
Registered: 8-2-2006
Location: Ontario, Canada
Member Is Offline
Mood: No Mood
|
|
The three sound board blanks of Sitka spruce have been made from four selected strips - i.e. are multiple piece construction.
The sound boards were supported for acoustic testing on three blocks fitted with rubber pads to isolate extraneous vibrations.
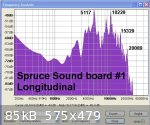
The results of acoustic tests on sound board #1 are shown here as an example. This sound board blank measures 548 mm overall length by 389mm width.
Unfinished thickness is 3 mm.
As with previous tests, the sound wave generated with the tiny hammer were recorded on a Zoom H2 digital recorder for analysis with Audacity software.
It was noted that the recorded amplitude of the sound wave signal was much less than previously recorded on the small rod samples - suggesting a
greater dispersion of the initial sound compression wave (from longitudinal, uniaxial direction) in the wide flat plate sound board. Increasing the
microphone gain on the Zoom H2 corrected the matter but made no difference to the analysed results.
The attached image of the spectrum analysis of the longitudinal axis 'standing' sound wave shows four frequency 'spikes' of 5117 Hz, 10229 Hz, 15329
Hz and 20089 Hz that stand out reasonably well among a whole lot of other stuff to confuse the issue. These are the first (fundamental) harmonic and
the second , third and fourth - f1, f2, f3, and f4. The second harmonic should be twice the frequency of the fundamental, the third three times the
fundamental and the fourth four times the fundamental - they don't quite meet these definitions but are close enough.
The speed of sound longitudinally can then be calculated for each harmonic where SOS = Frequency x Wavelength. The wavelength for the first harmonic
is 2x Sample Length (L), for the second harmonic L, for the third 2/3 x L and the fourth L/2.
The respective calculated SOS versus harmonic are, therefore, 5608 m/s, 5606 m/s 5600 m/s and 5504 m/s. If the consistent first three harmonics are
considered the average SOS is 5605 m/s.
The measured density of sample #1 is about 437 kg/m³.
From these figures the Dynamic Modulus of Elasticity (longitudinally) is 13.7 GPa and the acoustic radiation constant R is 12.8 - so within the
definition of a 'tonewood' - based upon acoustic measurement.
However, a complete evaluation of a tonewood should include an assessment of cross grain stiffness.
More to follow.
|
|
|
jdowning
Oud Junkie
Posts: 3485
Registered: 8-2-2006
Location: Ontario, Canada
Member Is Offline
Mood: No Mood
|
|
The results for the sound board acoustic test longitudinally - despite the 'noisy' frequency spectrum - seems reasonable enough with a SOS of 5605
m/s. (A somewhat surprising result, nevertheless, given that the sample is a thin flat plate rather than a long narrow rod).
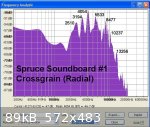
So what about the speed of sound cross grain? From these limited trials and according to data published by others, the SOS cross grain (radial axis)
of Spruce should be between 1000 m/s and 1800 m/s. (1/5 to 1/3 of the longitudinal SOS).
The attached image of the cross grain audio test again shows a 'noisy' frequency spectrum with a peak at 4054 Hz. However, if this is the fundamental
(1st harmonic) of the compression wave with the sound board blank width of 38.9 mm the computed speed of sound cross grain would be 4054 x 2 x 0.389 =
3154 m/s or about double what it should be. The correct first harmonic frequency should be in the range
1285 Hz to 2314 Hz but the closest frequency peak is 2510 Hz. Clearly these cross grain results are unreliable for determination of the radial speed
of sound in a thin sound board blank.
The difficulty may be that when the sample is 'pinged' the acoustic wave generated is unconstrained and so spreads out in all directions (albeit in
essentially two dimensions - travelling much faster in the longitudinal axis than the radial axis. This creates confusion in the reflected standing
wave resonance pattern with (presumably?) an over riding emphasis on the longitudinal frequencies. See the attached sketch.
Nevertheless, it may still be possible to apply this method to test sound board blanks acoustically - restricted only to parallel to the grain
acoustic tests - in order to help select the best material from a batch.
Note that sound board blank #1 gave the best results over those of blanks #2 and #3 that both returned ambiguous frequency spectra.
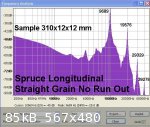
The results given by this simplified resonance method seem to work best with long narrow samples that provide distinct sharp frequency peaks
representing the first, second, third and possibly fourth harmonics as seen in the attached image of the frequency spectrum of a 310 x 12 x12 mm rod
of Spruce.
Optimum results may further depend upon the aspect ratio (Length/Width) of the samples (10 or greater ?) and a sound wave frequency peak of less than
20,000 Hz (possibly around 15,000 Hz max?). These preliminary proposed limits may be confirmed by further thoughts and testing.

|
|
|
jdowning
Oud Junkie
Posts: 3485
Registered: 8-2-2006
Location: Ontario, Canada
Member Is Offline
Mood: No Mood
|
|
Some further thoughts on the practical limits of the test sample length (rods) consistent with reasonably accurate SOS measurement.
For my test apparatus the frequency range of the Zoom H2 recorder is said to be 75 Hz to 20,000 Hz i.e. within the audible sound range.
The speed of sound parallel to the grain (longitudinal) in dry Spruce is generally between 5000 m/s and 6000 m/s. The uniaxial speed of sound is equal
to the resonant frequency x wavelength. For a resonant wave pattern the wavelength of the first harmonic is 2 x the length of the test sample, that of
the second harmonic is equal to the length, that of the third harmonic is 2/3 the length and that of the fourth harmonic is half the length.
The shorter the sample length the higher the resonant frequencies present in the spectrum analysis.
The length of the test sample should be sufficient to give clear resonant harmonic peaks in the frequency spectrum that are within the upper frequency
limits of the Zoom H2 recorder i.e 20, 000 Hz maximum.
This would limit the lengths of the test samples (assuming maximum SOS of 6000 m/s) to about 15 cm for the first harmonic frequency, to 30 cm for both
first and second harmonics, 50 cm for the first, second and third harmonics and 60 cm for the first, second, third and fourth harmonics.
Best results for calculating SOS should be based on the average of the first two harmonics - better still the first three or four harmonics.
This equates to a minimum test sample length of at least 30 cm for two clear harmonic peaks to a minimum length of 60 cm for four harmonic peaks.
So, the frequency spectrum of the Spruce sample previously posted - measuring 31 cm in length - has only the first and second harmonic frequencies
that are within the 20,000Hz limit even though the first four harmonic peaks are clearly shown.
The above applies to rod like test samples where the aspect ratio of length/width is greater than about 8 or better still greater than 10.
|
|
|
jdowning
Oud Junkie
Posts: 3485
Registered: 8-2-2006
Location: Ontario, Canada
Member Is Offline
Mood: No Mood
|
|
A good thing about this resonance method is that - with the Audacity software - results are quickly obtained.
Today, five samples of Sitka spruce partly prepared sound board material were acoustic tested to obtain more information about the effect of aspect
ratio when testing thin plates.
The test samples had the following dimensions:
Sample A - 613 x 192 X 3 mm - rough planed finish - Aspect Ratio 3.2
Sample B - suspect results to be retested.
Sample C - 512 x 112 x 3mm - sawn finish - AR 4.6
Sample D - 613 x 136 x 3.2 mm - sawn finish - AR 4.5
Sample E - 549 x 53 x 4.7 mm - rough sawn finish - AR 10.4
Sample F - 644 x 69 x 7.4 mm - sawn finish - AR 9.3
Sample E gave the best results with clear harmonic peaks up to the sixth harmonic. The first four harmonic frequencies (all within 20,000Hz) provided
calculated speed of sound velocities all within 1 % - the average being 5244 m/s.
Samples F gave only two clear harmonic frequencies within 2% with average SOS of 5234 m/s.
Sample C and D - provided 'noisy' frequency spectra with the first three harmonics discernible giving calculated SOS within 5% of each other average
about 5400 m/s. Calculated SOS showed an increasing value as harmonic frequency increased.
Sample A - provided a 'noisy' frequency spectrum from which the first three harmonics could (just about) be determined giving calculated SOS within 3%
with an average of 5788 m/s. Sample A was considered to be the best piece of sound board material of the batch - based upon visual assessment - so the
SOS results tend to confirm this.
Overall, these results tend to confirm that test samples should, ideally, have an aspect ratio of 10 regardless of sample thickness although the
aspect ratio may be lower than this for comparative purposes - i.e when selecting the best material from a batch..
|
|
|
jdowning
Oud Junkie
Posts: 3485
Registered: 8-2-2006
Location: Ontario, Canada
Member Is Offline
Mood: No Mood
|
|
Another factor considered to be important in assessing 'tonewood' sound board material - apart from the sound radiation coefficient R - is the loss
coefficient n which is a measure of the degree to which a material dissipates vibrational energy due to internal friction. As a sound wave bounces
back and forth within a test sample it loses energy in the form of heat at each cycle the amplitude of the sound wave being reduced at each cycle
until it reaches a level of zero amplitude over time. When this happens over only a few cycles the sound wave is heavily underdamped (high damping) by
the wood (and so emits only a dull sound if tapped) - when this happens over many cycles the sound wave is lightly underdamped (low damping) and wood
when tapped would 'ring'. The damping properties of wood has an effect on the characteristic tone colour and resonance of a wood. Generally low
damping (within limits) is considered best for plucked instruments with wooden sound boards but not necessarily for bowed instruments.
Damping can be measured in several ways - usually requiring costly laboratory equipment - so the next step in these trials using Audacity is to
determine if the software might also be used to measure the loss coefficient without any of the fancy equipment.
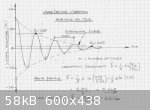
For a single sinusoidal wave - represented by a graphical plot of linear amplitude against time - damping can be measured by calculating the 'log
decrement'. The 'log' here has nothing to do with wood or trees but is a mathematical short hand for logarithm - a function that determines how many
times (the exponent) a number (the base) must be multiplied by itself to arrive at another number. A 'natural' logarithm has a base number equal to
about 2.71828 .... (known as e or Euler's number to mathematicians).
The attached graph, for example, represents a heavily damped vibration (amplitude versus time) - the vibration being reduced to almost zero in about
five cycles. The form of the envelope enclosing the decaying vibration amplitude peaks happens to be an exponential curve.
The logarithmic decrement then is the natural logarithm of the the ratio of the amplitudes of the successive damped vibration cycles or ln(Xo/Xn)
divided by the number of complete cycles (n) where 'ln' means the 'natural' logarithm.
In the attached arbitrary example the logarithmic decrement computed over 3 cycles comes to 0.667.
Once the log decrement has been calculated, the loss factor(n) is determined by dividing log decrement by 3.142 ... (or pi - that other well known
mathematical constant related to circumferences and areas of circles).
It has been proposed by others that the damping and acoustic coefficients might be combined as a new indicator of sound board efficiency called the
Acoustic Conversion Efficiency (or ACE) where ACE = the acoustic radiation coefficient (R) divided by the loss factor (n).
How all of this stuff is related see the paper 'Wood for Sound' by Ulrike G.K. Wegst - American Journal of Botany, 2006 at:
http://www.amjbot.org/content/93/10/1439.full.pdf
All of this is well and good but what about those of us who have long since forgotten - or never did care about logs or exponential curves or other
mathematical 'rocket science'.
Next to try to determine the log decrement, loss factor etc. of some of the spruce samples recently tested - using only Audacity software and a low
cost 'scientific calculator' - no mathematical knowledge required!!
|
|
|
jdowning
Oud Junkie
Posts: 3485
Registered: 8-2-2006
Location: Ontario, Canada
Member Is Offline
Mood: No Mood
|
|
Log decrement only applies - accurately - to a single sinusoidal wave pattern (as previously posted) so the next step in this investigation will be to
test if it possible to obtain meaningful results of loss coefficient from the more complex resonant wave patterns produced by this simplified acoustic
method.
Urlike Wegst (see link "Wood for Sound" previously posted) gives the range of values for loss coefficient in wood from about 0.1 for hot moisture
laden wood to about 0.002 for air dry wood at room temperature. For sound board wood, Wegst indicates that the loss coefficient is in the range of
about 0.003 to 0.01 (see tables 3 and 4 in her "Wood for Sound" paper) and states that the loss coefficient is independent of density and Young's
Modulus.
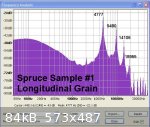
The first test sample in this trial is a piece of Sitka spruce from my stock of sound board material purchased in bulk from an aircraft manufacturer
originally destined for wooden airframes (gliders).
The sample measures 61.4 cm in length by 4.25 cm X 2.8 cm in section. Weighing the sample and calculating its volume, the density is 453 kg/m³.
The Audacity frequency analysis spectrum from the audio resonance test is attached and shows clear resonance peaks at 4777Hz (1st harmonic), 9480 Hz
(2nd harmonic - 1st X2), 14106 Hz (3rd harmonic - 1st X3) and 18955 Hz - (4th harmonic - 1st X4).
From this the speed of sound from the 1st harmonic frequency is 5869 m/s, 2nd harmonic - 5821m/s, 3rd harmonic - 5774m/s and 4th harmonic - 5819.
Average result - 5821 m/s (but probably a bit higher than this due due losses at higher frequencies).
From this Young's Modulus (SOS² X density) computes to 15 GPa and the Sound Radiation Coefficient, R (SOS/density) is 12.9.
So this material - according to Wegst (see Figs. 1 and 2 in "Wood for Sound" ) should be a good sound board material based upon acoustic tests.
Next to investigate if the calculated loss coefficient for this sample also supports this material as being good for sound boards - judged again upon
the published data by Wegst.
|
|
|
jdowning
Oud Junkie
Posts: 3485
Registered: 8-2-2006
Location: Ontario, Canada
Member Is Offline
Mood: No Mood
|
|
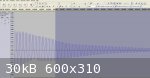
By highlighting the audio file in Audacity and magnifying the waveform horizontally (time scale) and vertically (amplitude scale) the waveform for
sample #1 becomes clearly defined. Note that - due to the complexity of the waveform - its outer boundaries are not defined perfectly by an
exponential curve (like the bell of a trumpet) particularly for the first 3 or 4 microseconds where there appears to be some instability. The waveform
then stabilises somewhat into an approximate exponential profile.
Clearly, due to slight repeated variations in amplitude every few cycles, calculations to determine the log. decrement and loss coefficient from this
wave form must be averaged over many cycles - say between 50 and 100 cycles.
In this case, the image of the waveform has been cropped to cover a range of 50 cycles and then printed to a hard copy so that values of amplitude can
be measured.
To improve estimation of amplitude values a simple tool - made from a plastic CD case - marked with 5 equally spaced lines converging to a single
point allows a more accurate subdivision of the vertical scale.
The calculation of log decrement does not require any mathematical knowledge just the use of a low cost basic 'scientific calculator' (this one cost
less than $10) which has a button for calculating the natural logarithm of a number - marked 'ln' (do not use the adjacent 'log' button!). Here is the
procedure in steps:
1) mark off 50 complete cycles on the waveform copy from X0 to X50 - that is there will be 51 peaks including X0. Treat the upper and lower halves of
the waveform separately.
2) measure the amplitude of X0 and X50 from zero on the vertical scale.
3) using the calculator, divide the amplitude value for X0 by that for X50 and press the 'ln' button. Divide this value by 50 to give the log
decrement.
4) divide the log decrement value by 3.142 (pi) to give the loss coefficient.
5) average the values of log decrement and loss coefficient by adding each of the two values and dividing by 2.
In this case 50 cycles were chosen but any other number could be selected - the greater the number the better the approximation. So, for example if 75
cycles are chosen just divide by 75 rather than 50 to get the log. decrement.
For this sample the average log decrement is 0.027 and average loss coefficient 0.008. The loss coefficient correlates with the data published in
"Wood for Sound" figs 3 and 4 falling within the definition of sound board material for Sound Radiation Coefficient,R versus Loss Coefficient and
Young's Modulus against Loss Coefficient.
This agreement is encouraging - suggesting that this method can produce a pretty good approximation for values of log decrement and loss coefficient -
so a second sample will next be tested for comparison.

|
|
|
jdowning
Oud Junkie
Posts: 3485
Registered: 8-2-2006
Location: Ontario, Canada
Member Is Offline
Mood: No Mood
|
|
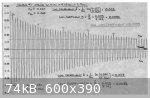
The second test for log decrement/loss coefficient is on Sample 2 - a piece of construction lumber graded 'SPF' found in my stock of wood. In Canada
softwood destined for construction work (new buildings etc) is both visually and mechanically graded at the mill for strength, MOE etc. Tree species
in 'SPF' grade (Spruce, Pine, Fir) can be any one of four - White Spruce, Engelmann Spruce, Lodgepole Pine and Alpine Fir. Among the highest grade
(Select) in the category is very likely some wood that might pass as sound board tonewood.
Let's see how sample #2 compares. Visually the sample is fine straight grained with no grain 'run out' due to spiral growth. However, the sample felt
'heavy' for its size. Calculating density by measuring volume and weight came to 514 kg/m³- a bit on the high side. Species is assumed to be
Spruce.
The prepared sample size measured 40 cm x 1.8 cm x 0.82 cm.
On acoustic testing the speed of sound longitudinally was 5410 m/s giving a sound radiation coefficient R of 5410/514 = 10.5. Young's Modulus
(D.M.O.E.) is then 5410² x 514 = 15 GPa
Checking with the data published by Wegst :
Fig 1 - comparing Young's Modulus versus Density the sample is just within the domain defining sound board wood.
Fig 2 - comparing Speed of Sound versus Density the sample is a borderline sound board quality wood.
The attached graph shows the wave form from acoustic testing. Calculating the loss factor over 50 cycles gives a value of 0.014. This is outside the
maximum value of 0.10 given by Wegst in Fig 4 but the sample is again a borderline case for sound board wood according to Fig 3 comparing R against
the Loss Coefficient.
So the value for Loss Cofficient derived from this method is again reasonably consistent judged from the Wegst data.
Next to test a smaller sample to determine if the method is limited to sample size.
|
|
|
jdowning
Oud Junkie
Posts: 3485
Registered: 8-2-2006
Location: Ontario, Canada
Member Is Offline
Mood: No Mood
|
|
Retesting Sample #2 with an improved test rig gave an average Loss Coefficient of 0.011 which is in much better agreement with the Wegst data than
previously reported.
Further tests with smaller section samples appeared to be less promising. The attached image of the waveform of a spruce sample measuring 31 cm in
length by 11.9 x 3.45 mm in section shows a much more erratic waveform that is obviously impossible to interpret accurately. The same applies to the
attached image of the waveform of a spruce sample cut perfectly on the quarter (cross grain or radial) measuring 61 cm by 12 x12 mm in section.
Nevertheless both show a heavily damped internal vibration even if the value of Loss Coefficient cannot be accurately calculated from the images. The
increased damping of the cross grain sample (compared to longitudinal grain) is to be expected and is of a level of magnitude confirmed by other
experimenters. The damping evident in the case of the small cross section sample is likely to be due to the small cross section area providing greater
resistance to the sound wave than might be experienced with a relatively larger sample like #1 previously posted.
Accurate analysis of the waveform of samples is further limited due to the small 'window' size provided by Audacity.
So reasonably accurate Loss Factor calculation using this method may be restricted only to larger specimens - although it may be useful for visual
comparative evaluation when smaller samples are available.
On the other hand evaluations of sound board materials based upon speed of sound acoustic testing using this method is pretty well unaffected by small
sample cross sections provided that the aspect ratio (length/width) ratio is greater than about 10.
|
|
|
| Pages:
1
2 |


